Disk I/O Graph Widget
The disk I/O graph widget shows read and write rates over time.
Features
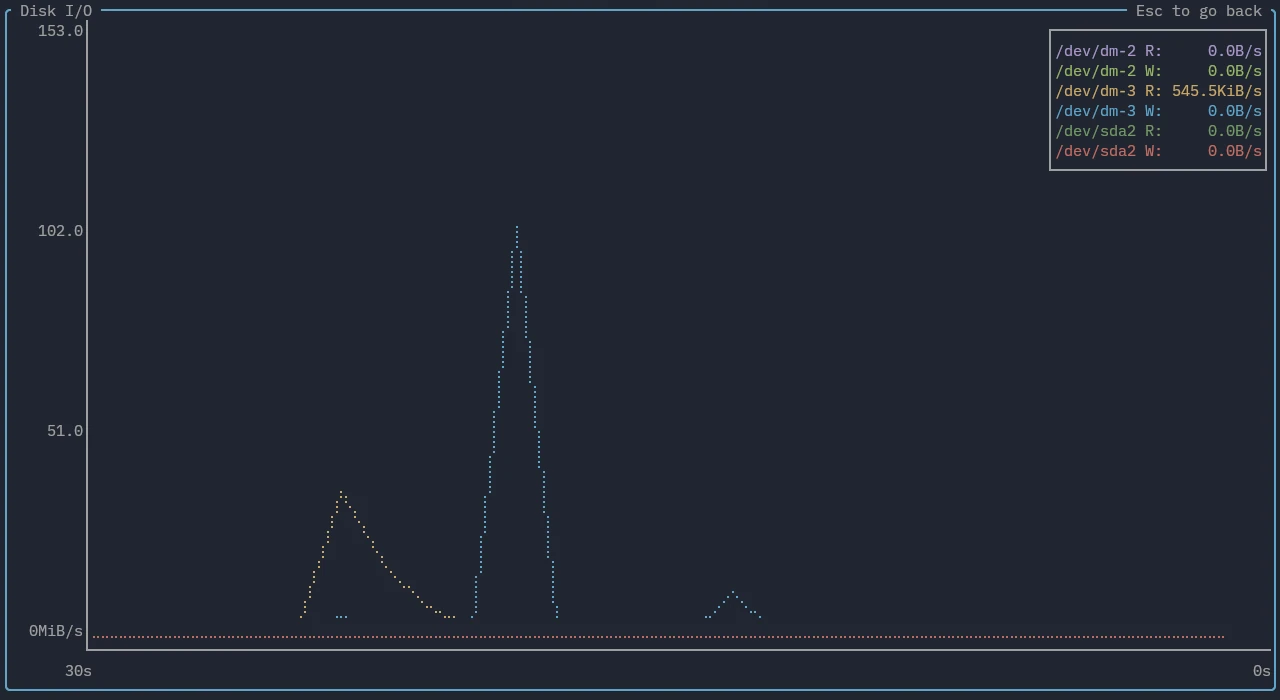
The legend displays the current reads and writes per second in bytes for each mount/disk item. The y-axis automatically scales based on shown read/write values. By default this is in a linear scale, but it can be switched to a logarithmic scale through the config file.
The displayed time range can be adjusted through either the keyboard or mouse.
Key bindings
Note that key bindings are generally case-sensitive.
| Binding | Action |
|---|---|
| + | Zoom in on chart (decrease time range) |
| - | Zoom out on chart (increase time range) |
| = | Reset zoom |
Mouse bindings
| Binding | Action |
|---|---|
| Scroll | Scrolling up or down zooms in or out of the graph respectively |